We’re delighted to announce that Learning Toolbox now includes an Analytics Reporting Tool letting you easily see the engagement data for all your ePoster stacks.
Find out how many times the ePosters are viewed during and after the conference. Identify the most popular ePosters and the ePosters that sparked the most discussion. View the analytics across your whole domain or look at the report for a specific showcase.
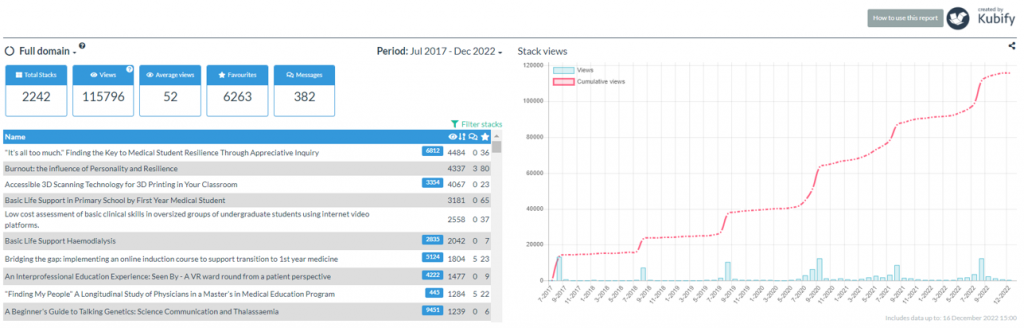
The report is updated every 2 hours and allows you to dig into the data to understand more about which ePosters your delegates find most engaging both during the conference and afterwards. Some conferences are already using this information to help shape and plan their future activities. Identify your star authors, find out which topics interest your delegates most, assess the impact of your communication with delegates – when does it have an impact on activity levels.
We ourselves have used the analytics to identify ePosters which have had great usage beyond the conferences and then talk with their authors about how and why they’ve continued to use their ePosters and what benefits they’ve seen. We’ll be reporting those stories next year. In the meantime we hope you enjoy exploring and learning from your own conference ePoster data.